This analysis isn't late - I just wanted to allow sufficient recovery time for athletes to be prepared to think about IM again... I've updated the IMNZ results files and generated a bunch of new comparisons for your edification. Or as a sleep aid - depends on how you feel about statistics.
At the basic level of analysis, the average time this year was faster than the last few years:
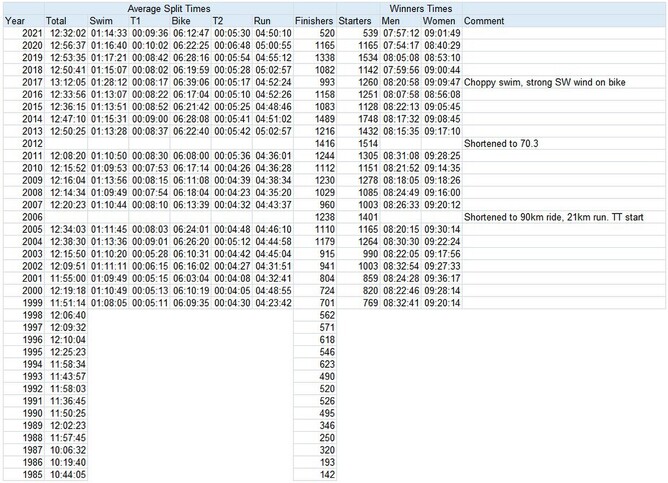
(you'll note that the summary now goes all the way back to the first IMNZ in 1985)
A much lower number of competitors this year, thanks to excluding the rest of the world from being able to travel to NZ. In this table the improvement in overall average time appears to have come from the bike and run legs.
Same Athlete Analysis
This analysis looks at the athletes who've competed more than once and compares to their average time across participarions:
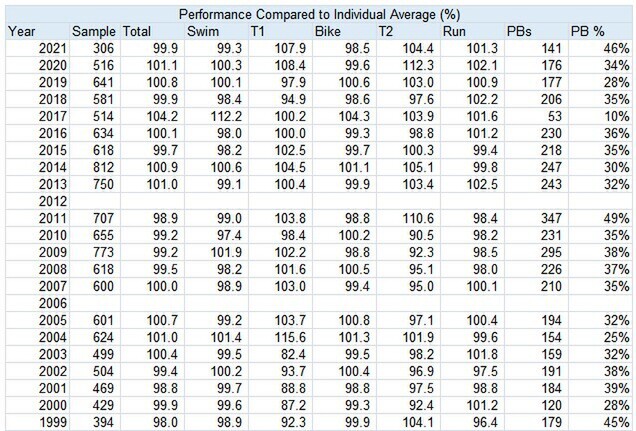
The fastest day on the bike on record, paired with a good swim day made up for a worse than average run day to deliver a good day for the overall.
Further - the PB analysis showed that 41% of repeaters set their personal best in 2021. Which backs up the other data in showing that it was a particularly fast day.
Weather/Course Analysis
The weather conditions were roughly 2mins slower than 2020 (for a 6hr rider), which shouldn't be any great surprise to anyone who read my forecast prior to the race. Primarily thanks to slightly higher air density.
However, the course this year loses a significant amount of elevation gain compared to the old course.
| Course | Elevation Gain |
| Taupo- Napier (Old) | 1058 |
| 2020 - Rifle Range out, Tahrepa return | 1010 |
| 2021 - Rifle Range out and back | 948 |
These figures are using Strava routebuilder (generally one of the better ways to measure as it uses aggregate data from all the rides recorded on a route).
Mapping the courses also suggests that the current course is 1km shorter than the original.
With that context - the bike times should be getting faster, regardless of conditions.
The CBI
I introduced this metric in this years Tauranga Half analysis and it's more than appropriate that the Cameron Brown Index should be calculated for IMNZ also:
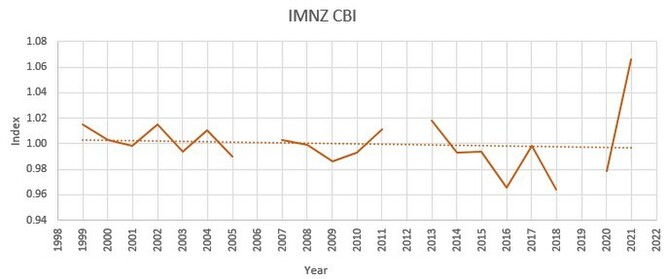
This is obviously very concerning. Some might view it as a correction - the CBI has defied expectation* for years . But this bucking of the trend (you can see the trendline has been on a downwards slope since 1999) was not forecast by any analysts**.
However, the time wasn't official thanks to a DQ for borrowing shoes, so perhaps the best way to deal with this outlier is to omit it...
*that you get slower as you get older
**I may be the only analyst monitoring the CBI, or IMNZ in any depth
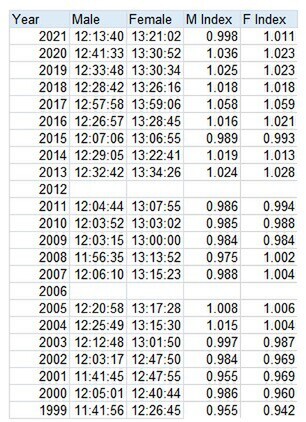
The Elite Race
Under 8hrs to win the mens race again, with the ladies win scored in just over 9hrs.
I've collated an index for that too:
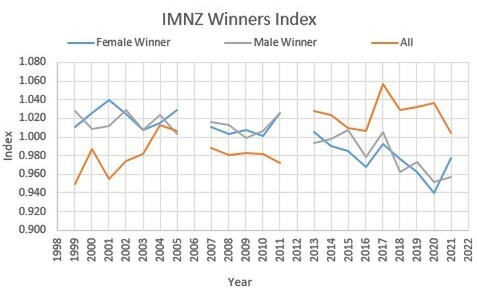
You can see from this that the winning times for each gender have been on the same progression over the years. In fact, the ladies have improved slightly more than their male counterparts (looking at average of first 3 years in Taupo vs latest 3 years). Particularly encouraging is that the winners at the start of the period were visitors while the recent stellar times have mostly been by Kiwi (current mens record Joe Skipper from GBR).
The boys do need to get moving on matching the improvement shown by the ladies - 7.48.21 in 2022...?
The Overall Race
Interestingly, the index above shows that the overall race (=primarily age groupers) has been steadily getting slower. This year reversed that trend substantially, so I delved further to isolate summary stats for NZ athletes over the years.
and graphically (the M and F indices are Kiwi only)
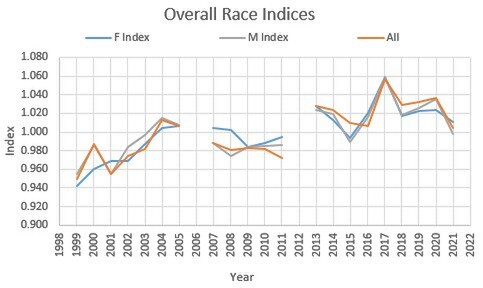
Clearly we can't claim that the absence of overseas athletes was the reason for the faster times this year, NZ athletes have been on the same trend as the overall stats.
I don't know whether this reflects the popularisation of Ironman in recent years, or a commentary on coaching and equipment choices. It certainly runs counter to the trend of the Elite athletes and course modifications.
Participation Frequency
I posted about this recently on facebook after seeing an ad pushing that athletes should be 'one and done' - turns out that making it past one puts you in the top 30% of nutca.. enthusiasts.
If, like me, you have done IMNZ 4 times - you're in the top 7% of recidivists. I only need to do it every year until I'm 70 to catch the current leaders (Mike Ramsay and Ron Skelton), both on 33.
(note that the number of athletes is on a log10 scale which compresses the numbers to fit in a reasonable space)
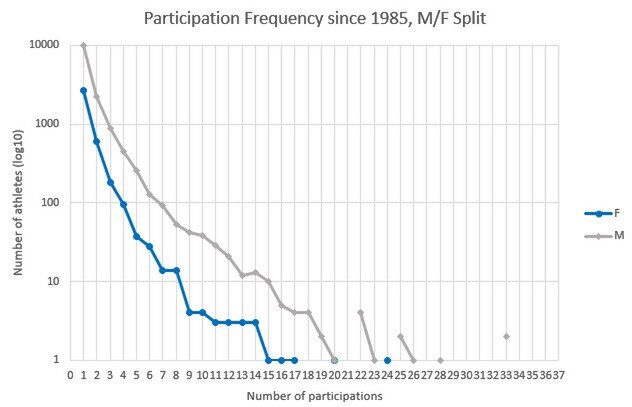
That's 14,559 out of 19,854* athletes who've competed once. Much of which is explained by being a destination race of course.
*don't have gender data for all athletes so graph doesn't total to this figure
Conclusion
A fast year according to every measure. Hopefully next year we can share the course with our tri-brethren from beyond our shores.
In the meantime, I hope the elite men are working to match the ladies and I shall hopefully commence a series of articles aimed at helping to reverse the progressive slowing of the last few years.