Time to dive into the results from the Olympic events last week - someone needs to cover the numbers that the news outlets gloss over.
I'll cover the individual events seperately to the MTR - they were going to be together but I started digging into the MTR with the consequence that there is quite a lot of information just for that event.
The hotly anticipated first time inclusion of the Relay was both exciting and predictable. The racing was fierce but the podium followed the form guide.
The graph below shows how each teams deficit tracked compared to the leading team. It may look bewildering at first but take a moment and you'll see that points at which the line angles down mean the team is closing on the lead. Overall of course, the trend tends to be that all the teams outside the top 3 are steadily losing time (I've run this analysis on all the major events for the past couple of years).
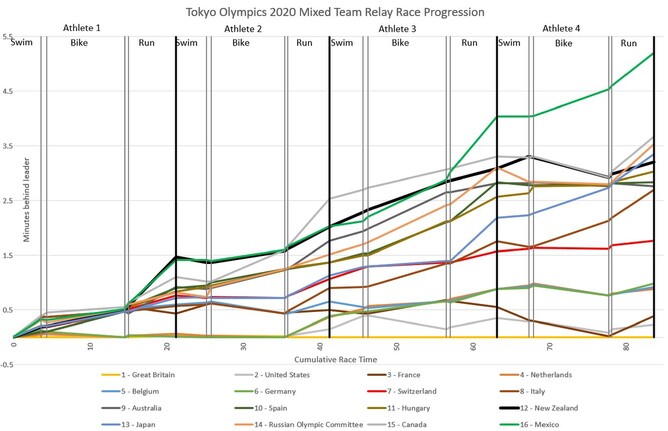
It's worth noting that there is some nuance missed in the graph - for instance Vincent Luis caught Alex Yee half way through the 4th bike leg and they rode together. As I don't have the splits for that the graph just shows Luis steadily gaining to be the same at the end of the bike.
The aim of this visual representation is to help understand how the race developed, which a results sheet doesn't automatically portray. And in the case of the NZL team, it lets us know what happened once they disappeared from the coverage.
A few points of interest:
- Russia had a shocker on Leg 2 T1 - lost 10s and you can see in the graph that moved them from 3rd group to 4th - setting the tone for the rest of the race
- Alex Yee was like lightning through Leg 4 T2 as nearly all the other lines move upwards in that segment. Also very sharp on the run with only Jake Birtwhistle putting any time in (from 3mins back)
- Alex Yee took the swim bike comparatively easy, in order to nail the run
- Anyone that made gains on the lead on the bike paid for it on the run (no downwards line on the bike is followed by a downwards run line)
The main value of this style graph is showing that discussions of the relative strengths of athletes on any leg are pointless if you haven't also determined where they will be in the field. In many ways the first athlete determines the performances of the rest of the team.
MTR Place vs Ranking
This is an easy comparison, green for improvement, red for the other direction
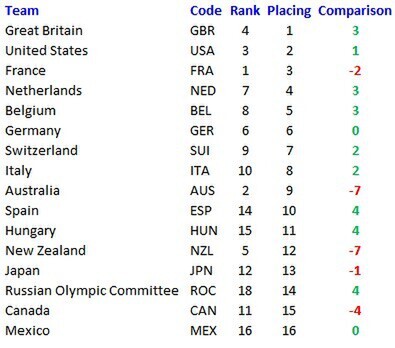
NZL and AUS kindly made it easy for other teams to move up relative to their ranking by vacating their top spots.
GBR had a nice improvement, but they hadn't needed to focus on MTR qualification as a path to earning Olympic spots, so rarely raced a full strength team during the ranking period.
Olympic MTR vs Test Event
The test event was held two years ago to allow teams to preview the course. It also offered a lot of information about what to expect on the big day.
Out of 64 athletes, 21 competed on the same leg as the test event, with an average improvement of 2.8% (their Olympic time 97.2% of test event time).
This table shows the relative performances of the teams, with green meaning better than the average improvement and red meaning worse.
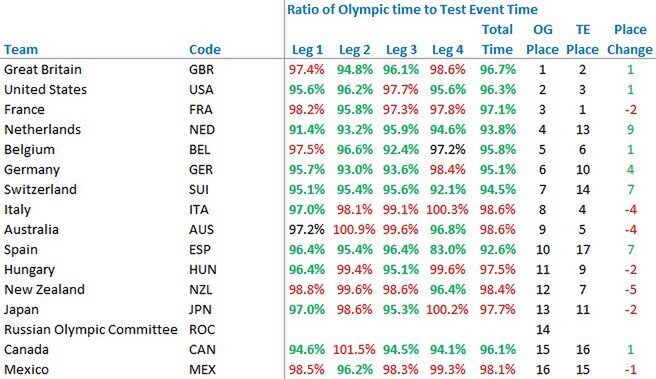
The standout performers are clearly the Netherlands (yes, the Spanish final ratio is better but they bombed the test event), it's noteworthy that Maya Kingma had the greatest improvement over the last two years and that supercharged first leg put the team with stronger other teams to keep gaining relative to the past performance. They didn't gain a medal but it looks like they've figured out the trick to a good MTR.
This comparison backs up the idea that Alex Yee was able to take his swim/bike easy (the individual medal clearly shows he has improved since the test event) then nail the run. The GBR team were certainly the highest likelihood to win, based on the improvement of their athletes and adding Jonny Brownlee to the team. The lack of the first pack swimmer on leg 1 for FRA was always going to harm their prospects - this showed through with Vincent Luis having to work so hard on swim/bike that he couldn't run with Yee or Pearson.
For AUS and NZL it's only their final athletes (who did not race in the test event MTR) that provided any improvement, but too little too late.
What went wrong for the NZ team?
Nothing really. The result roughly matches the readiness of the team that was selected.
- The ranking was inflated by some lucky breaks in qualifying
- NZ one of the few nations that really focused on MTR as the path to four spots instead of trying to get athletes ranked in the top 28
- The olympics means that other teams are full strength, which has been extremely uncommon in the qualifying period
The comparison to the test event and other strong fields shows that a large deficit after leg 1 should have been expected.
As I discussed with my brother the night before:

OK, so it was over 3mins. In my defense, I hadn't fully modelled the field and didn't want to be too pessimistic. In any case - at the Olympics there is no chance to make that back.
Why didn't NZ field a stronger team? That's a question to be put to the decision makers.
Reasons for Faster Times
The winning time improved nearly 3mins and as shown above - all teams went faster. Are there any reasons for this beyond being a pinnacle event?
Using the 'Same Athlete Analysis' method that I employ for comparing long course events:
- T1 appears to be shorter, but that's only 3s of the total
- T2 was the same
- Run was the same
- A 2% improvement on the swim is a small contributor
- 4% on the bike makes the largest difference as it is the longest time segment of the race
Most of the corners on the bike course were defined by major traffic barriers, so it doesn't seem likely that the course was signficantly shorter.
Therefore the best explanation is two years of training and peaking for a major event.
Summary
It should be no great surprise that the teams who performed well had lifted their game compared to qualification and the Test Event. Much of the change in various performances is driven by the outcome of the first leg and the logical conclusion for a team wishing to raise their level would be to focus on this.
Both the Australian and NZ teams will be hoping for improved showings in next years Commonwealth Games...